Reaching your goals is possible with better business insights
Tracking and analyzing agency operations and customer data is key to smart decision-making. EZLynx has built-in reporting and analytics that provide real-time insights into how your agency is performing. Since EZLynx is an all-in-one platform, your data is unified in one organized place. You don’t have to worry about exporting or importing data because sales, service, quoting, and retention metrics are all connected.
Intuitive, visual dashboards show your data insights in a way that's easy to understand, so you can see how you’re progressing towards goals and stay on track to hit your performance targets. Plus, you can whip up customer reports that focus on just the info you want at any moment, which saves you from digging through a bunch of unnecessary data. EZLynx can help you get a complete picture of your agency in real-time to identify growth opportunities, measure productivity, and optimize your business strategy.
How can you make data a competitive advantage?
There are a lot of things you can do with reporting! Here are just a few examples of the insights you can learn from reports that can help improve your agency's operations.
- LOBs generating the most new business
- Producer performance
- Account rounding opportunities
- Expiring policies
- Compliance and audit preparation
- Customer coverage gaps
- Carrier contingency commissions
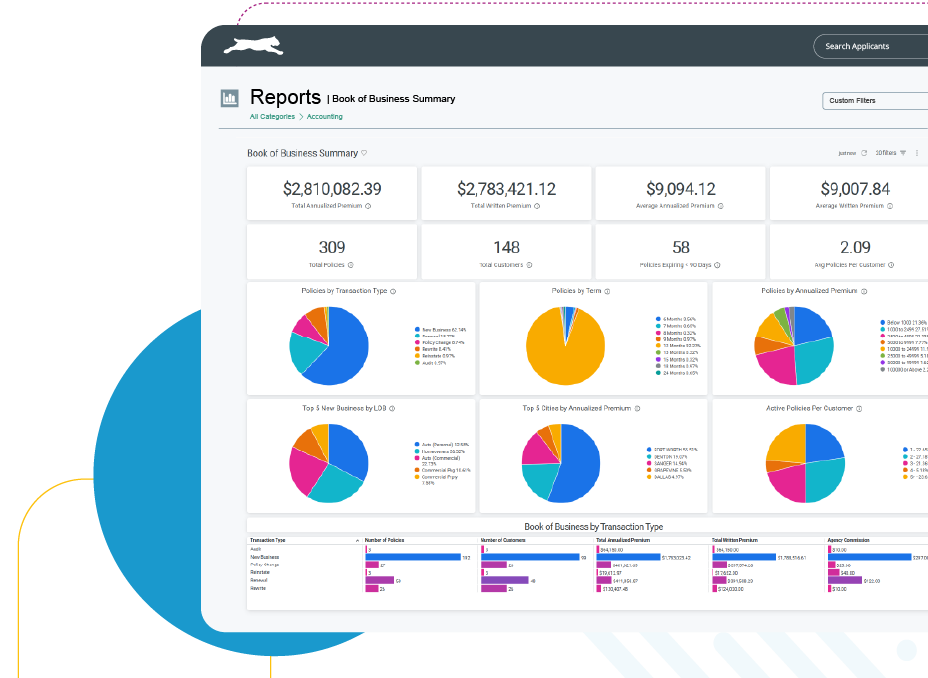
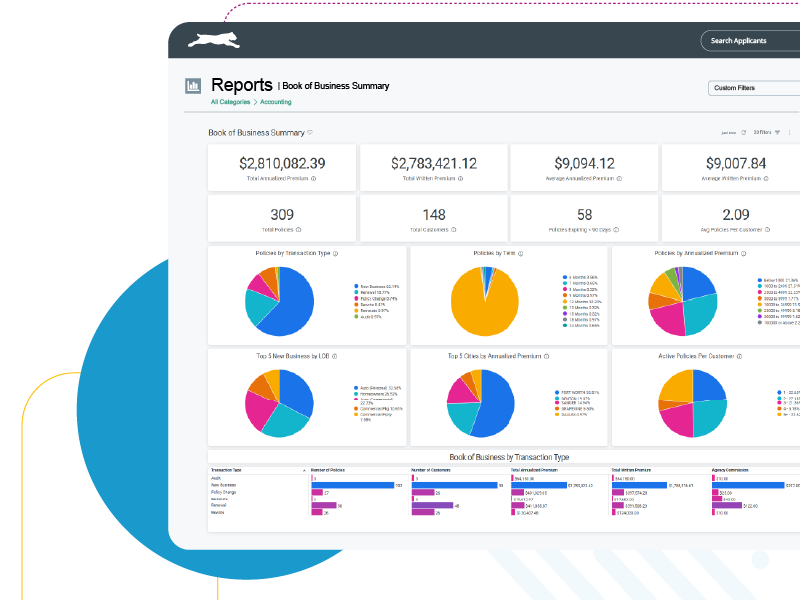
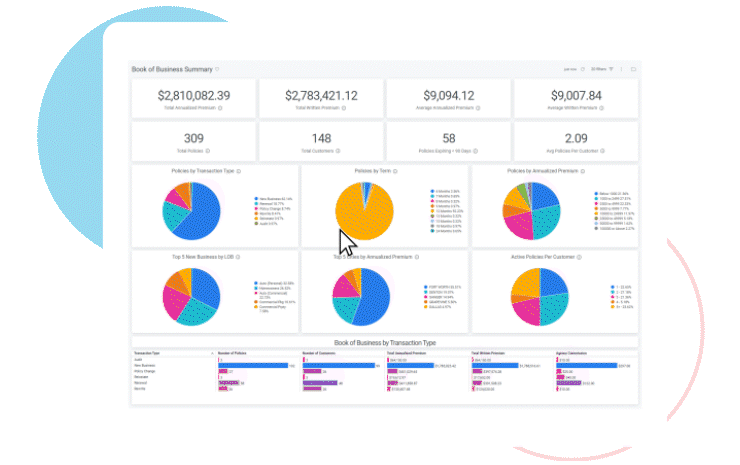
EZLynx reporting in action
Let’s jump into the platform to show you how easy it is to get actionable insights. You’ll notice stunning drill-through charts, graphs and data grids bring key metrics front and center. From here, you can click on any data point to drill down into the details further.
What can reporting and analytics do for your agency?
Agency Pulse, a monthly business insights report, highlights key data and trends for your agency and its growth. The Peer Benchmarking section compares your agency's metrics, like policies per customer and premiums per customer, against those of peer agencies across the insurance industry.
Summary Reports allow you to see key metrics for accounting, sales pipeline, revenue, and more in real time, making it easy to stay on top of agency performance.
EZLynx gives you the power and flexibility to filter, group, and visualize data in the way that works best for your agency. Track your top producers, policy types, or close rates, whatever moves the needle for you.
With EZLynx, build reports once and schedule them to run on your timetable. You can take these reports to internal meetings, send summaries to producers, or share KPIs with leadership without extra steps or reformatting.
Our customers say it best
We asked real agents who use EZLynx to share how our reporting and analytics software helps them.
-
“With EZLynx’s reporting features, I get real-time visibility into my agency’s performance across key metrics like sales pipeline and revenue, helping us effectively track our goals as we seek to build out our book of business.”
Principal, Granen Insurance


Resources
-
 Leveraging Data Into Growth and Profits: An EZGuide
Learn how to use data to monitor your agency’s health, lean into strengths, and quickly find and address weaknesses.
Read Now
-
 Customer Success Workshop: Getting Ready for Reports 5.0
Discover what’s new with Reports 5.0 and get tips for smoothly transitioning before the current reporting platform is retired.
Watch Now
-
 Data: Your Agency's Secret Weapon
Explore some of the capabilities to look for when evaluating insurance data analytics software.
Read Now
Resources
-
Leveraging Data Into Growth and Profits: An EZGuide
Learn how to use data to monitor your agency’s health, lean into strengths, and quickly find and address weaknesses.
Read Now
-
Customer Success Workshop: Getting Ready for Reports 5.0
Discover what’s new with Reports 5.0 and get tips for smoothly transitioning before the current reporting platform is retired.
Watch Now
-
Data: Your Agency's Secret Weapon
Explore some of the capabilities to look for when evaluating insurance data analytics software.
Read Now